Is Britain's climate changing?

Hurricane Irma has dominated conversation over the last couple of weeks after causing widespread and catastrophic damage and at least 84 deaths in parts of the northeastern Caribbean and the Florida Keys. Scientists have claimed that the effects of climate change, from warmer oceans to rising sea levels, made the hurricane more catastrophic than it would have been in previous decades. Although Hurricane Irma hasn’t changed President Trump’s view on climate change, society is starting to see how climate change amplifies natural events.
Here in the UK, the weather is variable and often unpredictable. In fact, its diversity and changeability make British weather so distinct and unique. But even in the UK, it is clear climate change is having an impact on our weather.
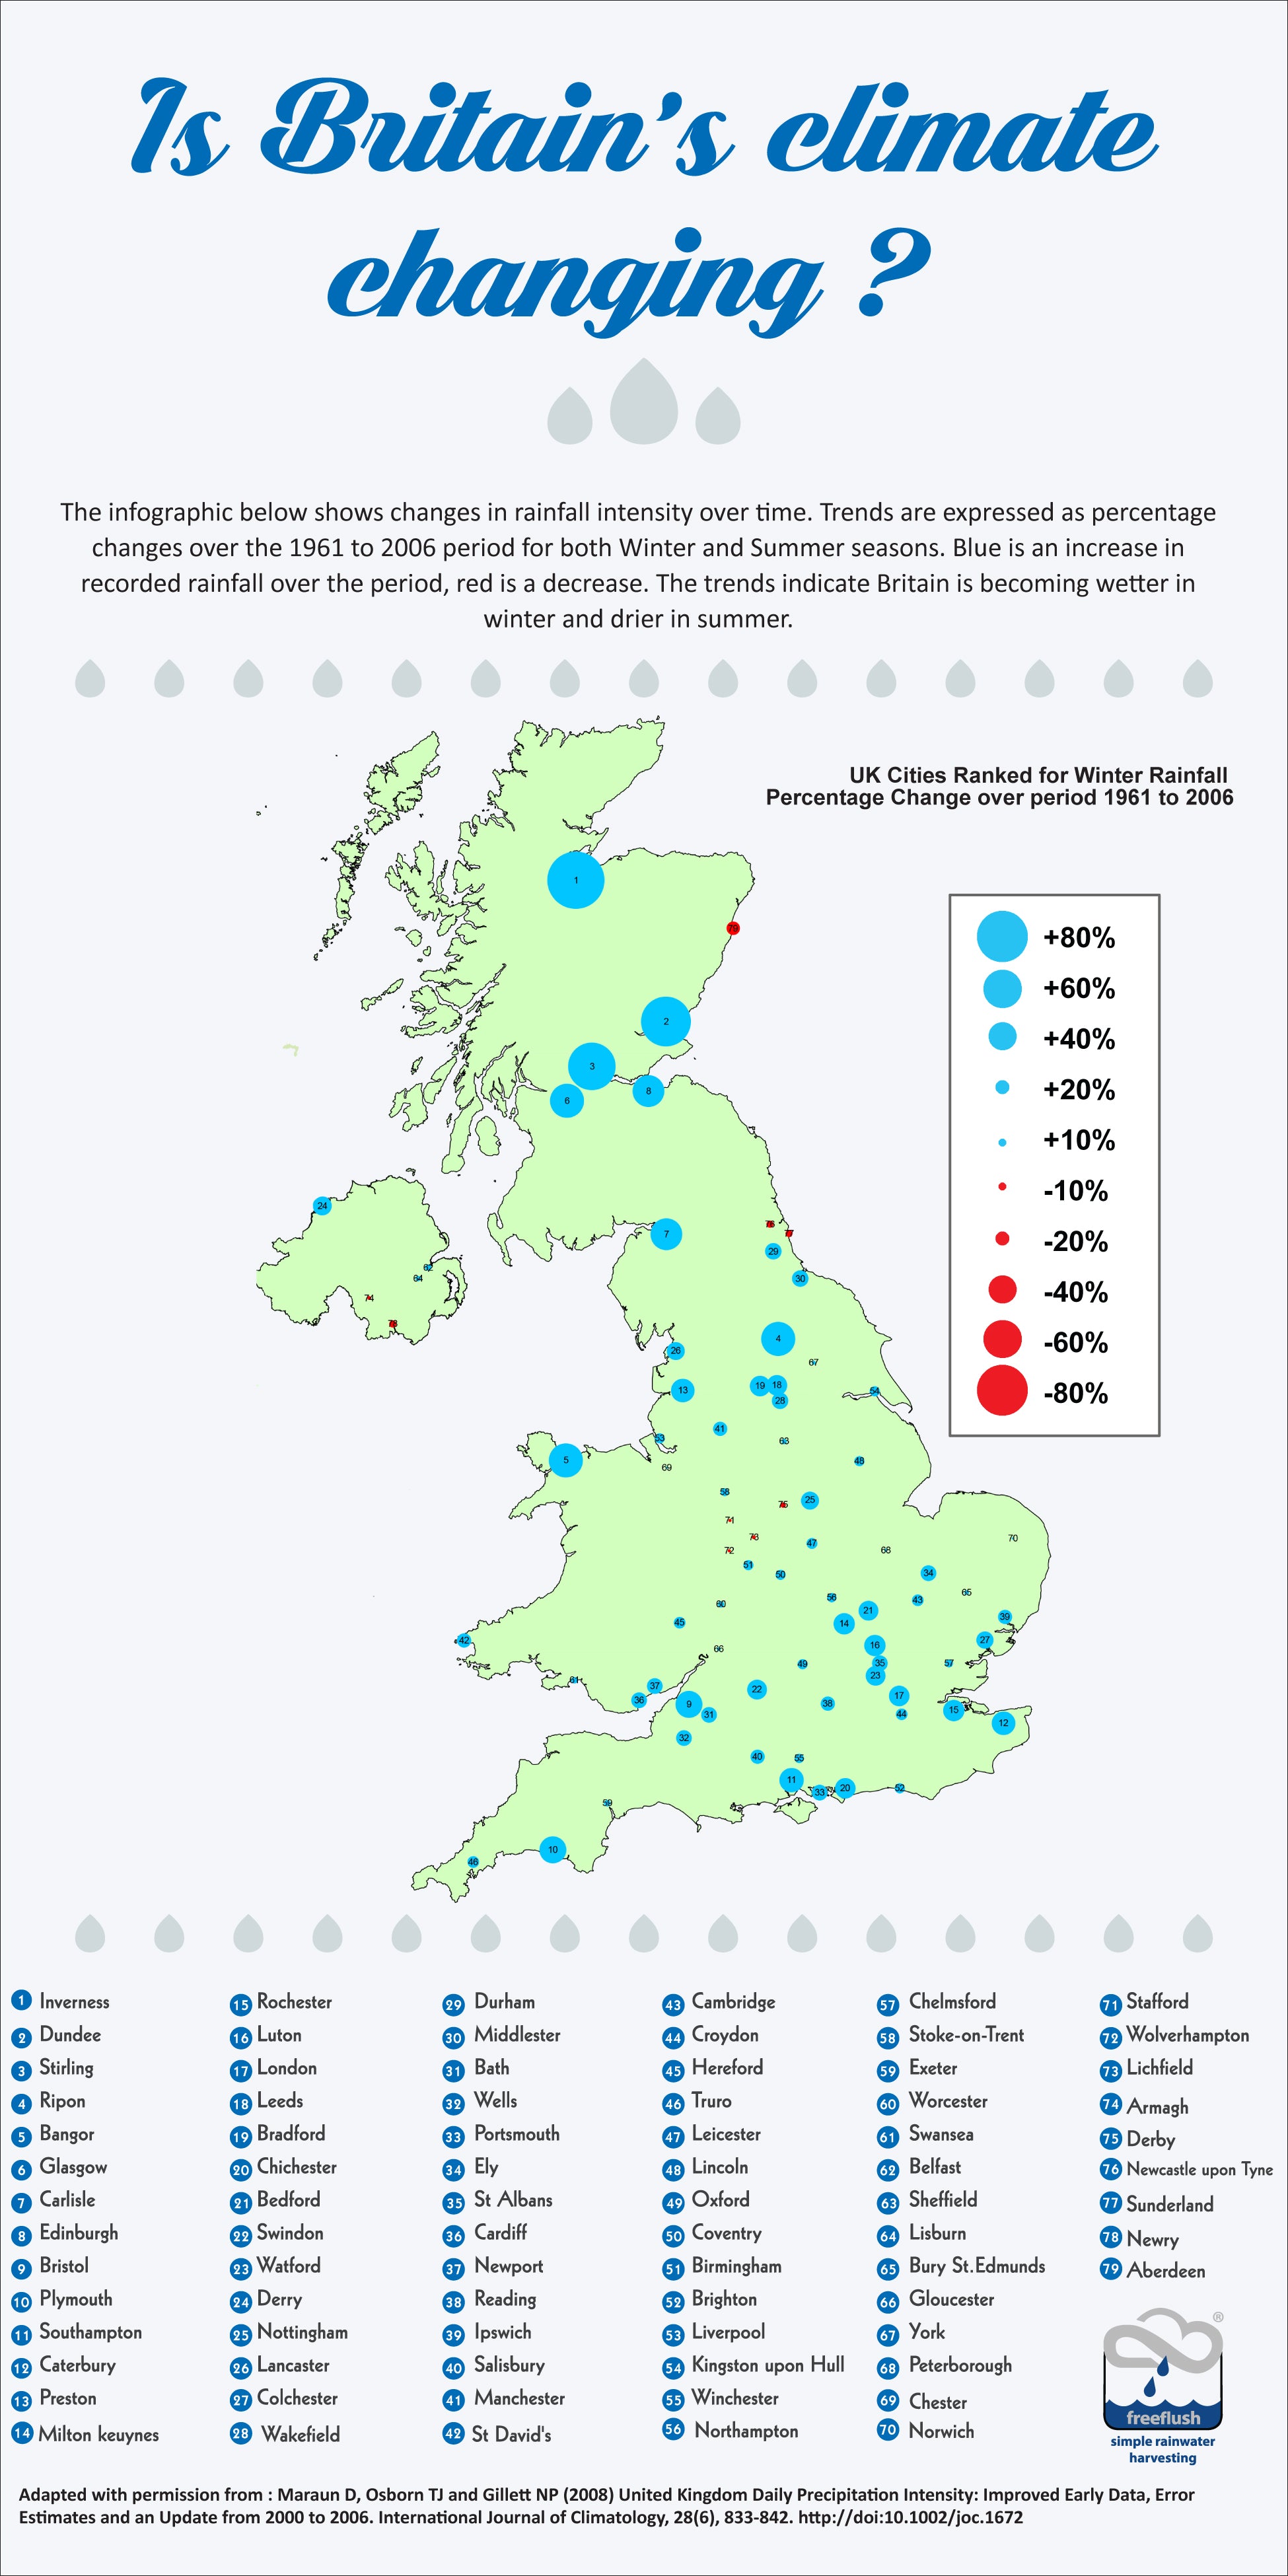
Here at FreeFlush, we provide rainwater harvesting and storm water solutions and so the changing weather patterns have an dramatic impact on designing such systems. We have examined rainfall change by city over the period 1961-2006 based on captured rainfall data. We’ve created two graphics below to display our findings. Why not take a look at your area and see how its climate has changed.
In the winter months, we found that Inverness has seen the biggest rainfall increase, followed by Dundee, Stirling, Ripon and Bangor.
In the summer months, Rochester has seen the biggest rainfall decrease, followed by Canterbury, Wells, Reading and Bath.
If you wish to use this infographic on your site please use the embed code below.
The original research paper from which this infographic has been adapted can be found here.


Use the interactive table below, pressing the arrows on the column headings, to rank cities by Winter and Summer Rainfall Change.
| City | Winter Rainfall Change (%) | Summer Rainfall Change (%) |
|---|---|---|
| Aberdeen | -17 | -29 |
| Armagh | -5 | -9 |
| Bangor (Gwynedd) | 43 | -29 |
| Bath | 20 | -30 |
| Bedford | 25 | -17 |
| Belfast | 8 | 8 |
| Birmingham | 13 | 18 |
| Bradford | 26 | -19 |
| Brighton | 13 | 11 |
| Bristol | 34 | -21 |
| Bury St. Edmunds | 6 | 8 |
| Cambridge | 15 | -7 |
| Canterbury | 30 | -32 |
| Cardiff | 20 | -5 |
| Carlisle | 40 | -18 |
| Chelmsford | 10 | 10 |
| Chester | 3 | -16 |
| Chichester | 26 | -15 |
| Colchester | 22 | 12 |
| Coventry | 13 | 18 |
| Croydon | 15 | -21 |
| Derby | -7 | 8 |
| Derry | 24 | 4 |
| Dundee | 63 | -13 |
| Durham | 21 | -23 |
| Edinburgh | 40 | 8 |
| Ely | 20 | 9 |
| Exeter | 8 | -18 |
| Glasgow | 43 | 8 |
| Gloucester | 5 | -21 |
| Hereford | 15 | -21 |
| Inverness | 72 | -6 |
| Ipswich | 18 | 20 |
| Kingston upon Hull | 13 | -8 |
| Lancaster | 23 | -26 |
| Leeds | 26 | -19 |
| Leicester | 14 | 8 |
| Lichfield | -5 | -17 |
| Lincoln | 13 | 25 |
| Lisburn | 7 | 14 |
| Liverpool | 13 | -18 |
| London | 26 | -23 |
| Luton | 27 | -17 |
| Manchester | 18 | -23 |
| Middlesbrough | 21 | -13 |
| Milton Keynes | 27 | -17 |
| Newcastle Upon Tyne | 9 | -23 |
| New Port | 20 | -5 |
| Newry | -9 | -11 |
| Northampton | 12 | -21 |
| Norwich | 3 | 20 |
| Nottingham | 23 | 14 |
| Oxford | 13 | -23 |
| Peterborough | 4 | -5 |
| Plymouth | 43 | -21 |
| Portsmouth | 20 | -15 |
| Preston | 30 | -29 |
| Reading | 18 | -30 |
| Ripon | 43 | -10 |
| Rochester | 27 | -32 |
| Salisbury | 18 | -7 |
| Sheffield | 7 | 14 |
| Southampton | 31 | -11 |
| St Albans | 20 | -17 |
| St David's | 18 | 31 |
| Stafford | -4 | -5 |
| Stirling | 60 | 10 |
| Stoke-on-Trent | 10 | -8 |
| Sunderland | -9 | -12 |
| Swansea | 8 | -25 |
| Swindon | 25 | -8 |
| Truro | 15 | 14 |
| Wakefield | 21 | -13 |
| Watford | 25 | -21 |
| Wells | 20 | -30 |
| Winchester | 12 | -13 |
| Wolverhampton | -4 | -5 |
| Worcester | 8 | -11 |
| York | 5 | -17 |
Embed Britains warmest cities on Your Site: Copy and Paste the Code Below and Share this Image On Your Site.
- Jack Cairney
Comments 0